
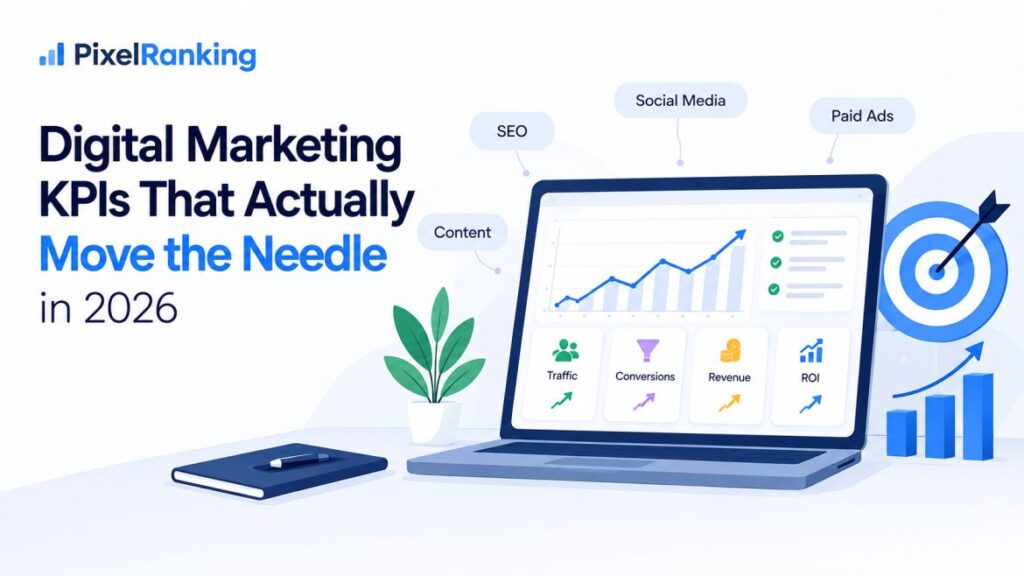
Most marketing dashboards are stuffed with numbers nobody acts on. Impressions climb, sessions climb, and yet the phone doesn’t ring any more often than it did last quarter. That gap between “the metrics look fine” and “the business is actually growing” usually means someone is tracking the wrong digital marketing KPIs, or too many of the right ones with no plan for what to do when they move.
Picking KPIs isn’t about collecting every number a platform offers. It’s choosing the handful that show whether spend is turning into pipeline, and increasingly in 2026, whether your brand is even visible in the places people now search: AI Overviews, ChatGPT, and Perplexity, not just the traditional blue links.
Start With the Metrics That Tie to Revenue
Traffic and engagement numbers matter, but they’re leading indicators at best. The KPIs worth building a strategy around are the ones a CFO would nod along to.
Customer Acquisition Cost (CAC) is total marketing and sales spend divided by new customers won in the period. A campaign that doubles traffic but also doubles CAC hasn’t improved anything; it’s just spending more for the same margin.
Return on Investment (ROI) closes the loop: net profit from a campaign divided by what it cost, times 100. We’ve seen teams celebrate a campaign purely on click volume, only to find the ROI math never worked once ad spend was counted honestly.
Conversion rate, split by channel and funnel stage, shows where the friction actually is. A landing page pulling strong traffic but converting at 0.4% has a page problem, not a traffic problem, and more ad spend won’t fix that.
If a metric can’t be traced, even loosely, to cost per customer or revenue per campaign, it belongs in a secondary dashboard, not the one leadership reviews monthly.
Engagement Metrics: Useful as Diagnostics, Not Goals
Bounce rate, session duration, pages per session, and social engagement rate are diagnostic tools. They explain why a conversion metric moved, but shouldn’t be the target themselves. A high bounce rate on a store locator page is often fine; visitors got the address and left. The same rate on a product page is a real problem.
Email marketing follows the same logic. Open rate and click-through rate matter, but unsubscribe rate is what predicts whether your sender reputation holds up six months from now.
The KPI Category Most Dashboards Are Still Missing: AI Search Visibility
Here’s where 2026 breaks from the KPI playbook most teams built in the 2010s. A growing share of research now happens inside AI Overviews, ChatGPT, and Perplexity before a user ever reaches a search results page, and none of the metrics above capture whether your brand shows up there.
A few numbers worth adding:
- AI citation rate: how often your pages get cited or linked when AI assistants answer questions in your category.
- Share of AI voice: your citation share relative to named competitors on the same query set.
- AI Overview appearance rate: the percentage of your tracked keywords that trigger an AI Overview, and whether you’re represented in it.
These aren’t vanity numbers. Independent citation studies have found that pages built around a direct answer positioned right under a question-style heading get cited noticeably more often than pages that bury the answer in paragraph three, and that adding original data or a specific statistic can meaningfully lift citation odds. Freshness matters too, especially on Perplexity, where recently updated pages tend to outperform stale ones on identical topics.
If your organic click-through rate has quietly dropped while rankings held steady, an AI Overview may be answering the query before the user scrolls to your listing. That’s a problem your existing tools won’t flag, which is why AI visibility needs its own line item instead of hiding inside “organic traffic.”
Structured Data: The KPI Enabler Nobody Tracks Directly
Schema markup doesn’t show up as its own KPI, but it quietly influences several of the ones above. Article, FAQPage, and Organization schema give both classic search engines and AI systems a clean, unambiguous read on what a page is about and who’s behind it. Sites that skip structured data aren’t disqualified from AI Overviews or citations, but they’re asking the crawler to guess, and guesses lose to certainty.
Agencies like Pixel Ranking treat schema as a standing item in every technical audit for this reason: it’s inexpensive to fix and it removes ambiguity that would otherwise cost visibility in both classic SEO and AI search.
A Practical Checklist
- Pick three to five revenue-tied KPIs (CAC, ROI, conversion rate by channel) as the primary dashboard.
- Keep engagement metrics as diagnostics, checked only when a primary KPI moves unexpectedly.
- Add AI citation rate and AI Overview appearance rate for the top 20 to 30 keywords.
- Audit Article, FAQPage, and Organization schema across key pages.
- Review revenue KPIs monthly, AI visibility metrics quarterly.
Bringing It Together
The teams getting the clearest read on their marketing in 2026 aren’t tracking the most metrics. They’ve cut the list down to what actually predicts revenue, and added the one category most dashboards still lack: whether AI systems can find, trust, and cite them at all. Get the digital marketing KPIs right, and every other reporting conversation gets shorter and more useful.
Frequently Asked Questions
What are the most important digital marketing KPIs to track? CAC, ROI, and conversion rate by channel are the core three, because each connects directly to revenue rather than just activity.
How is AI search visibility different from a normal SEO KPI? Traditional SEO KPIs measure ranking position and organic traffic on classic search results. AI search visibility measures whether AI Overviews, ChatGPT, or Perplexity cite your content when answering a question, which can happen even when your ranking hasn’t changed.
Should small businesses track AI Overview appearance rate? Yes, at least for their highest-value keywords. Tracking 15 to 20 core queries monthly is enough to spot whether an AI Overview has started intercepting clicks that used to reach the site.
Does schema markup directly improve rankings? Not on its own, but it helps search engines and AI systems parse page content accurately, which supports eligibility for rich results and AI citations.
How often should marketing KPIs be reviewed? CAC and ROI are worth reviewing monthly. AI visibility metrics move more slowly and are usually better reviewed quarterly.
What’s a common mistake companies make when choosing KPIs? Tracking too many metrics without a clear owner or action tied to each one. A KPI that nobody is responsible for acting on is just a number on a slide.
